Regime Detection – The Simple Approach That Works
Inspired by Roman Paolucci. Go watch his stuff. It's good.
Here's something that actually works. Not fancy. Not complicated. Just useful. Regime detection. Figuring out what kind of market you're in before you trade it.
The idea is simple. Markets exist in different states. Some states favour trend following. Some favour mean reversion. Some want you to stay away entirely.
The trick is knowing which state you're in. That's the whole game.
What Even Is A Regime
Think of it like weather. Sometimes it's sunny. Sometimes it's stormy. Sometimes it's dead calm.
You don't wear a raincoat when it's sunny. You don't trade aggressively when the market is volatile. You adjust based on conditions. That's regime detection.
A market regime is just the current state of the market. Is it trending? Is it ranging? Is volatility high or low? These conditions determine what strategies make sense.
Different strategies work in different conditions. Trend following loves strong trends. It dies in ranging markets. Mean reversion loves calm markets. It gets destroyed in volatile ones.
The strategy has to match the conditions. That's not optional. That's the foundation.
What it might look like
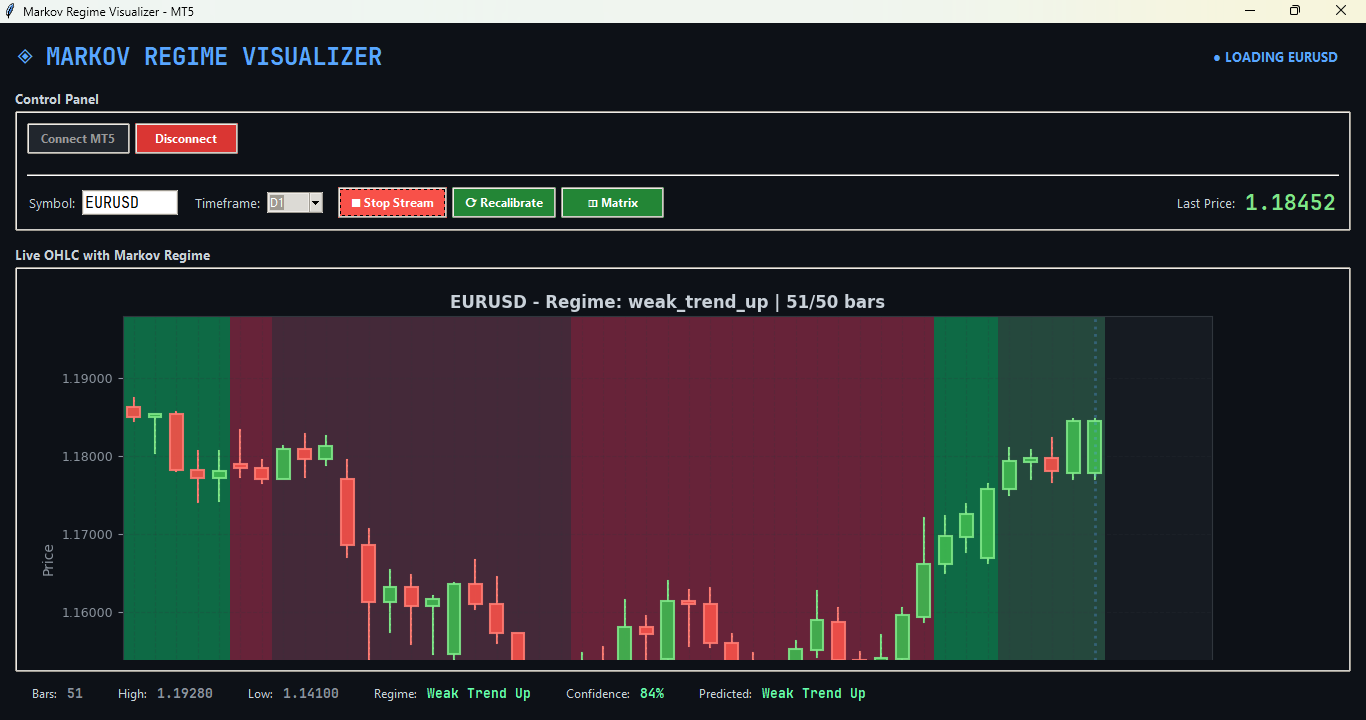
Just a visual tool forked from Roman's approach. Helps you see wheether you're visaully capturing various states of the market.
The Three Things That Matter
Here's what I learned. Not from textbooks. From losing money. Three things determine the regime:
1. Trend Strength
How strong is the current trend? That's the first question.
A trending market moves in one direction consistently. A ranging market goes nowhere. The difference determines everything.
There's a standard indicator for this. It's been around for decades. It measures directional movement. Not up or down. Just how strong the movement is.
When trend strength is high, trends tend to continue. When it's low, they tend to reverse. That's the key insight.
2. Return Direction
Where has the market been moving? That's the second question.
Not predicting. Observing. The recent past tells you the current environment. Positive recent returns = bullish bias. Negative = bearish bias.
This sounds obvious. It is obvious. That's the point. Don't overcomplicate what works.
The bias matters because trends tend to persist. Bull markets keep going up. Bear markets keep going down. Don't fight the bias.
3. Volatility
How crazy is the market right now? That's the third question.
Not absolute volatility. Relative volatility. Is it more volatile than usual, or less? That's what matters.
High volatility = stressed market = danger = smaller positions. Low volatility = calm market = opportunity = normal positions.
Volatility regimes matter for risk management. They always have. They always will.
The Framework
Here's how it works:
1. Measure the three things at every bar of new information
2. Classify the current regime based on those measurements
3. Only take trades that match the regime
4. Size positions based on regime clarity
That's it. Four steps. Each testable. Each improveable.
The regime isn't a prediction. It's a filter. It tells you which trades to take, not which way to trade.
Statistical Concepts (For The Real Ones)
Here's the technical stuff. Skip if you just want the practical take.
The Markov Property
A stochastic process is Markov if the future depends only on the present, not the past. That's the Markov property. P(Xt+1 | Xt) = P(Xt+1 | Xt, Xt-1, ...).
In markets? Debatable. The assumption doesn't hold perfectly. But it approximates reasonably well on short timeframes.
Stationarity
A process is stationary if its statistical properties don't change over time. Mean, variance, autocovariance - constant.
Financial returns aren't stationary. That's the fundamental problem. The variance changes. The regimes change. The relationships break.
What I've built isn't a stationary model. It's a conditional classifier. Given these conditions (high directional movement, elevated vol), what's the distribution? The model adapts. That's different from assuming stationarity.
Hidden States vs Observed States
The academic approach: assume hidden states with transitions governed by a Markov chain. Observe returns. Infer states via Baum-Welch.
The problem: convergence isn't guaranteed. Multiple local optima exist. Different initializations = different results. That's not robust.
My approach: observe the states directly. Don't hide them. The regime is what you see, not what you infer. That's simpler. Sometimes simpler is better.
Likelihood and Estimation
The ML approach maximizes likelihood: P(data | parameters). Given returns, what's the most likely regime sequence?
The issue: likelihood rewards complexity. More parameters = higher likelihood. That's overfitting with extra steps.
Proper validation uses out-of-sample likelihood. Or walk-forward testing. AIC/BIC penalize complexity. Simpler models generalize better.
State Transitions
Markov chains model transitions: P(st = j | st-1 = i). The transition matrix captures regime dynamics.
In practice: the transition matrix drifts. What's true in 2020 isn't true in 2024. The model assumes time-homogeneity. Markets aren't time-homogeneous.
Rolling windows partially address this. Retraining addresses this. But it adds complexity. At some point, the complexity costs more than it benefits.
Volatility Clustering
Moving averages and volatility models capture volatility clustering. High vol leads to more high vol. Low vol follows more low vol.
That's a stylized fact. It's real. My relative volatility measure captures this indirectly. Not as sophisticated as GARCH, but it works.
The goal isn't sophistication. The goal is working.
Why The Math Matters
I learned this in my actuarial degree. Stochastic processes. Time series. And more nonsense.
The math prepares you to think about risk. It doesn't prepare you to trade. Those are different skills.
But understanding the math lets you spot BS. When someone's "machine learning" is just overfitting with a neural network, you can explain why it's broken.
That's valuable. Not for trading. For evaluating claims.
Why Not Machine Learning
I tried ML approaches. Hidden Markov Models. Gaussian mixtures. Neural networks. Here's what happened:
Inconsistent. Same data, different results. Run it twice, get different regimes. That's not a feature. That's a problem.
Overfitted. Backtests looked amazing. Forward tests failed. The model memorized, didn't learn.
Uninterpretable. Even when it worked, I couldn't explain why. If I can't explain it, I can't trust it.
Drifted. What worked last year doesn't work this year. Constant retraining. Added complexity without added value.
Black box. The model gives you a number but not the reasoning. That makes debugging impossible.
Math doesn't hold. The assumptions behind ML (stationarity, ergodicity, convergence) don't hold in markets.
ML is a tool. Not magic. Know when to use it. Know when not to.
What Actually Works
Simplicity. That's what.
Deterministic. Same inputs, same outputs every time. No random seeds, no variation.
Interpretable. You can see exactly why the regime was classified this way. That's debugging.
Testable. You can validate regime detection independently. Run on historical data. See if it makes sense.
Robust. Doesn't drift. Doesn't break. Doesn't need constant retraining.
Sometimes the fancy solution isn't the better solution. Simplicity wins.
The Test That Matters
Here's how I validate this. Not backtests. Walk-forward testing.
1. Train on earlier data. Test on later data.
2. Roll forward. Repeat.
3. Compare filtered vs unfiltered performance.
That's the only test that matters. If it works forward, it works. If it doesn't, it doesn't.
Hypothesis: Certain regime conditions favour trend continuation.
Test: Run with and without filter. Compare.
Result: Filtered performs better. That's validation.
The Math Behind Walk-Forward
For the people who want the formal framework:
Train window: t to t+N
Test window: t+N to t+N+M
Walk: Shift by M, repeat. That's the walk-forward.
You get multiple out-of-sample periods. Multiple performance estimates. The distribution of those estimates tells you robustness.
Mean: Expected performance
Std: Variance of performance - lower is better
Sharpe ratio: Mean / Std. Risk-adjusted. That's the real metric.
Backtests lie. Walk-forward tells truth.
What This Gives You
Here's what regime detection provides:
Context. You know what environment you're trading in. That's crucial.
Filtering. You only take trades that match conditions. That's edge preservation.
Risk management. You size based on clarity. Ambiguous regimes = smaller trades.
Process. You're not guessing. You're responding. That's systematic.
The goal isn't to predict. It's to adapt.
Limitations
I need to be honest. This approach has issues too.
Lag
Regime detection lags. The market enters a new regime. The indicators catch up. By then, you're one step behind.
All indicators and mathematical approaches that require new info have lag. This one does too. Accept it. Manage it.
Parameter Sensitivity
The lookback periods matter. You can overfit them.
Don't tune on in-sample only. Walk-forward validate. That's how you avoid overfitting.
Regime Instability
Markets can switch regimes instantly. The detection is retrospective. It tells you what was happening. Not what's about to happen.
That's not a bug. That's reality. Nobody predicts regime changes. Nobody.
Why Gatekeeping
I keep the code private. Here's why:
It needs work. Not finished. Not optimized. Sharing now creates expectations I can't meet.
It needs testing. More walk-forward validation. More robustness checks. More time.
The concept is enough. You know the approach. Trend strength + return direction + relative volatility. That's the idea. You can build your own.
It keeps me honest. Internal improvement > external defense. I'm optimizing, not explaining.
That's gatekeeping. Not to be special. Just to be real. Plus you never know if its a money maker. :)
The Takeaway
Here's what matters:
1. Markets have regimes. Understand the state you're trading.
2. Simple beats complex. Deterministic > stochastic. Interpretable > impressive.
3. Test everything. Walk-forward validates. Backtests lie.
4. ML isn't magic. It's a tool. Know when to use it. Know when not to.
5. Gatekeeping works. Keep it real. Keep improving. Keep your edge.
That's the quant journey. Not finding perfection. Building process. Testing it. Improving it.
Now go build something simple. Test it. Break it. Fix it. That's how it's done.