RESEARCH NOTE
Can We Forecast Risk Better Than Returns?
Working notes on what this question might mean, what evidence could help answer it, and what I still want to investigate.
Abstract
People often say financial risk is easier to forecast than returns. These working notes unpack what that could mean, explore evidence for and against the idea, and set out data and tests that could help us think about it.
On this page
Working note — a question in progress, not a result I have settled.
People sometimes say that financial risk is easier to forecast than returns. I can see why: markets have quiet spells and turbulent spells, while predicting whether prices will go up or down often seems frustratingly difficult.
But what exactly are we comparing? Is it the chance of a rough month against the direction of the market? How would we know one forecast was “better”? I’m starting here because I don’t want a catchy claim to do the thinking for me. You do not need to be a forecaster to think along with this note; the technical terms are explained as they come up.
First, what do we mean by “risk” and “returns”?
There is no single number called risk.
- Volatility describes how much returns move around. High volatility means larger movements in either direction; it does not, by itself, mean losses.
- Downside risk focuses on bad outcomes: for example, the chance of a large loss or how severe losses might be.
- Drawdown asks how far an investment falls from a previous high before recovering.
“Returns” can mean the average return we expect over a period, whether the next return will be positive or negative, or the size of the next movement. Those are different questions too.
So, for now, I’m treating the title as an invitation, not a precise test. A useful version might be: For a particular asset, horizon and definition of risk, do forecasts improve on a simple benchmark more consistently than forecasts of returns do? We would need to repeat that comparison for more than one definition before making a broad claim.
Why might someone think risk is easier to forecast?
One intuition is persistence. After a market has become unusually turbulent, it may remain turbulent for a while. This is often called volatility clustering. If a forecast can use recent movements to anticipate more movement, that seems like a kind of predictability.
But predicting how much prices may move is not the same as predicting whether they will rise or fall. A weather forecast might help us pack for rain without telling us exactly where each raindrop will land. In a similar way, a volatility forecast could be useful even when the direction of returns is unclear.
This is a starting intuition, not yet evidence that risk is easier to forecast overall. We would still need to say what “easier” means and make a fair comparison.
A first look at the data
These two charts are a small first exploration, not a verdict. I used daily US market-factor data from the Kenneth R. French Data Library[1] to make monthly observations from 2000 to 2025. The upper panel in Figure 1 shows monthly market excess returns. The lower panel shows a volatility proxy: the square root of the sum of squared daily excess returns in each month, scaled to an annual rate. In everyday terms, it gives a rough picture of how much the market moved around that month.
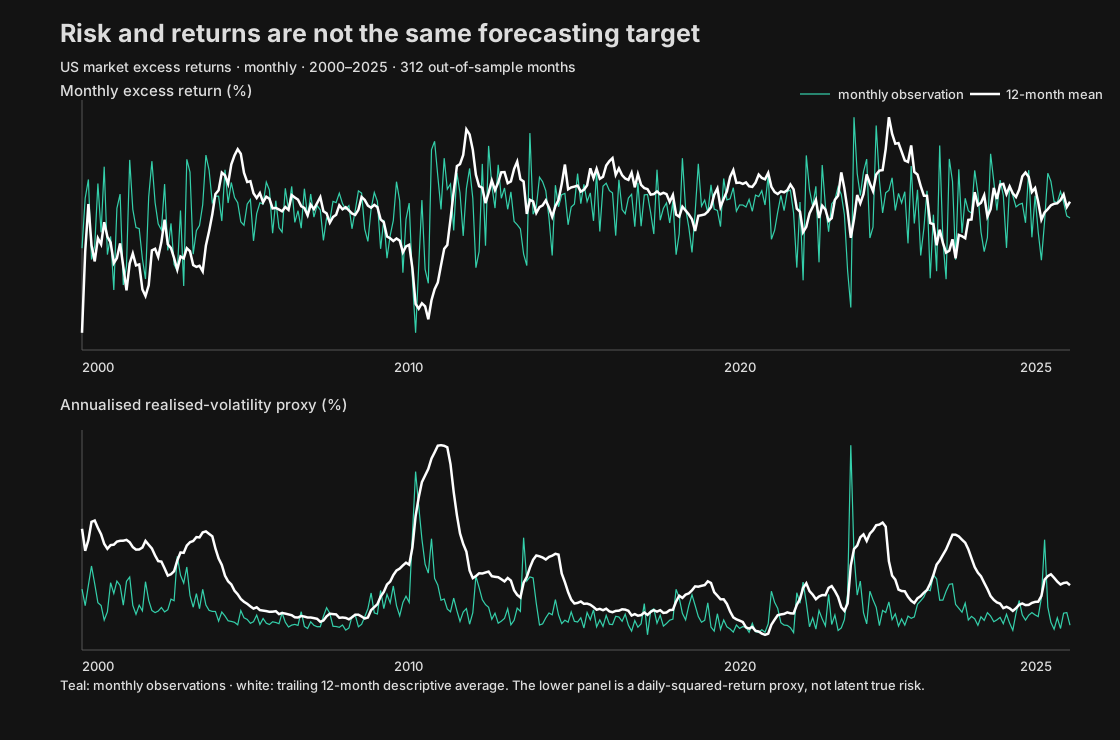
Figure 1. The lower panel is a rough proxy built from daily squared returns; it is not a direct reading of every kind of financial risk. Source: Kenneth R. French Data Library, direct daily-data ZIP. Download the monthly data used for the chart.
A few questions I find myself asking while looking at it:
- Do the volatile periods seem to arrive in clusters? Would that impression change if we used daily or weekly charts?
- Does a calm-looking period tell us much about the next large move?
- Which parts of the chart are hard to interpret because the units or scale are unfamiliar?
- If we looked at a different country, asset, or measure of risk, would the picture change?
These are prompts for looking, not claims that the chart has answered them. The dataset is one US market series; it cannot speak for every investor or market.
What have I found so far?
A few papers give me useful starting points, but none answers the title question by itself.
Andersen and co-authors study modelling and forecasting realised volatility using high-frequency financial data.[3] Their work helps explain why researchers treat volatility as something that can be measured and forecast. It is not a direct contest between “risk” and return forecasts, and the daily data in my chart are a much coarser measure.
Goyal and Welch examine many proposed predictors of the US equity premium, the extra return from equities over a safer investment. In the periods they study, many predictors do not beat a simple historical-average benchmark out of sample.[4][5] That is a reason to be cautious about confident return-prediction claims. It does not show that no returns can ever be forecast, or that all risk forecasts are better.
There is also a measurement problem. We do not observe the true, underlying volatility directly. We use proxies, and a noisy proxy can affect which forecast looks best. Patton explains why comparisons using imperfect volatility measures need care, and why the ranking can depend on assumptions about how the proxy relates to the quantity we want to forecast.[2]
My current reading is modest: there are good reasons to investigate persistence in volatility, and good reasons to be sceptical of easy return-prediction claims. That still falls short of showing that risk forecasts are generally better.
A small experiment — one branch of the notebook
I also tried a deliberately simple comparison. It uses the same US market-factor dataset as Figure 1 and asks whether two basic models improve on a historical average:
- For returns, does the average of the preceding 12 months help forecast next month’s market excess return?
- For the volatility proxy, does carrying forward last month’s value help forecast next month’s value?
Each forecast is compared with its own expanding historical-mean benchmark. The experiment found no improvement from the trailing return average. Carrying forward last month’s volatility proxy had lower average forecast loss in this sample, but the estimated difference is uncertain and the advantage changes across subperiods.
That is interesting enough to keep in the notebook, but it is not a fair universal race between risk and returns. The two targets use different measures and scoring rules. I have only tested one market, one horizon and one simple model for each target. This is an example of what I have tried, not the answer to the wider question.
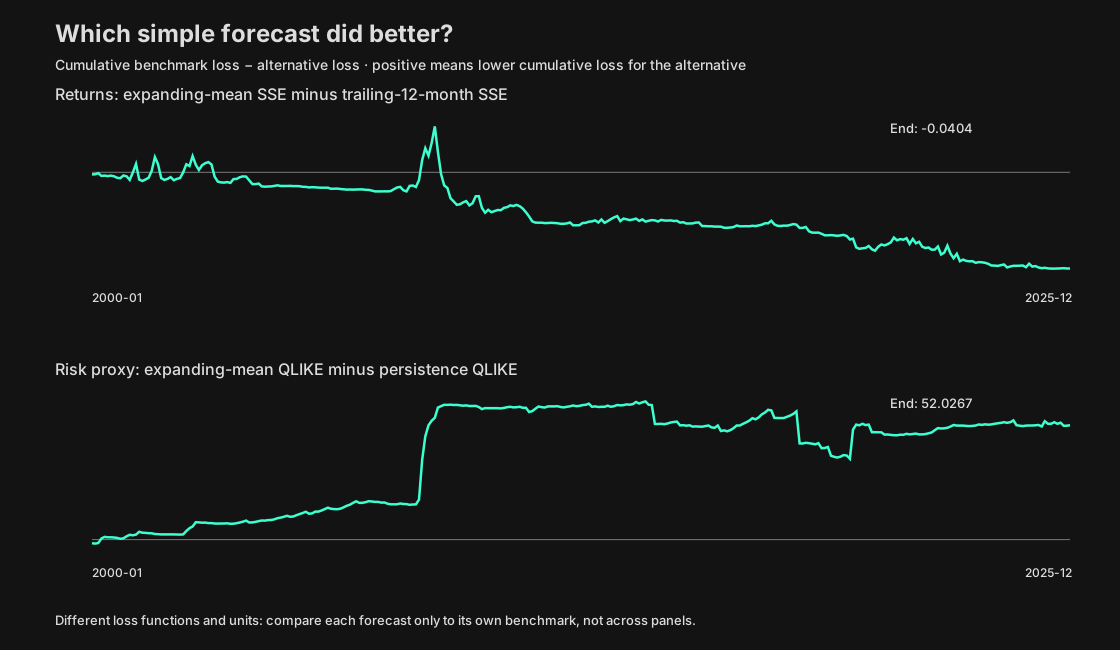
Figure 2. This early model comparison uses squared error for returns and QLIKE for the volatility proxy, so the panels should not be compared with each other. Source: monthly forecasts derived from the French Data Library daily data. Download the plotted forecast data; download the direct daily-data ZIP; see the analysis code.
What would make the question clearer?
Before extending the experiment, I want to work through a few choices:
- Which risk matters here? Volatility is a natural place to start, but it is not the same as the chance of a crash or the size of a drawdown.
- Which returns are we trying to forecast? The next month’s direction, average return, or size of the movement?
- What counts as “better”? Raw forecast errors for different targets are not directly comparable. One possible starting point is to ask how much each model improves on a transparent benchmark for its own target, then see whether that improvement persists across samples and markets.
- For whom is the forecast useful? A forecast may be statistically more accurate but still not change an investment or risk-management decision.
- How much should we trust a result from one period? Market behaviour changes. We should look at other periods and markets, report uncertainty, and be wary of trying many models before reporting only the winner.
These choices may lead to several smaller questions rather than one grand yes-or-no answer. That seems more honest, and more interesting, than pretending that one chart or test can settle the matter.
Data and possible next steps
The original daily factor data and documentation are available from the Kenneth R. French Data Library; the daily ZIP file is the source used by my script. For anyone who wants to follow this particular experiment without rebuilding it first:
- Monthly forecast data: observations, forecasts and losses
- Summary of the experiment and subperiod results
- Python script that downloads the source file and regenerates the data and charts
Some next steps I’m considering:
- Find data for a second market or asset and see which parts of this picture travel.
- Compare another risk measure, such as downside risk, rather than treating volatility as all of risk.
- Read more research that evaluates risk and return forecasts using clearly described benchmarks and genuinely out-of-sample data.
- Decide in advance which comparisons to make, then check whether the findings survive different periods and reasonable choices of method.
Questions I’m leaving open
- When people say “risk is easier to forecast”, are they talking about volatility, losses, or something else?
- Is a persistent forecast useful if it tells us that a period may be turbulent but not which way prices will move?
- What data or study would make you more persuaded that risk is—or is not—more forecastable than returns?
- Which part of this question should I look at next?
These are working notes. I expect to revise them as I read more, try different data and learn which parts of the question are actually testable. If you come from a different background, I’d especially like to know what you notice in the charts or what you think I have missed.
Papers and data sources
- Kenneth R. French, Data Library. Daily Fama/French factor data and documentation; the direct ZIP used by the script is linked above.
- Andrew J. Patton, “Volatility forecast comparison using imperfect volatility proxies,” Journal of Econometrics, 160(1), 2011, pp. 246–256. Public full-text PDF.
- Torben G. Andersen, Tim Bollerslev, Francis X. Diebold and Paul Labys, “Modeling and Forecasting Realized Volatility,” Econometrica, 71(2), 2003, pp. 579–625. Public full-text PDF.
- Amit Goyal and Ivo Welch, “A Comprehensive Look at The Empirical Performance of Equity Premium Prediction,” The Review of Financial Studies, 21(4), 2008, pp. 1455–1508. Journal record.
- Public full-text PDF of Goyal and Welch (2008).
I have read the full texts of the three papers linked above and checked that the linked PDFs are publicly accessible. These notes are provisional; the papers study different questions and do not together settle the title question.
Sources
[1] https://mba.tuck.dartmouth.edu/pages/faculty/ken.french/data_library.html — Kenneth French Data Library [2] https://public.econ.duke.edu/~ap172/Patton_vol_proxies_JoE_2011.pdf — Patton 2011, full-text author PDF [3] https://econ.duke.edu/~boller/Published_Papers/ecta_03.pdf — Andersen et al. 2003, full text [4] https://doi.org/10.1093/rfs/hhn014 — Goyal and Welch 2008, journal DOI [5] https://breesefine7110.tulane.edu/wp-content/uploads/sites/16/2015/10/Goyal-and-Welch-2008.pdf — Goyal and Welch 2008, publicly accessible full-text copy